SMEs are the backbone of many economies. They provide jobs, support local communities, and contribute to the overall growth of their country. However, SMEs often underestimate the power and usability of data analysis. In this blog post, we will be looking at some signs that you need data analysis in order to improve your business.
Table of Contents
Do you need Data Analysis?
In this era, data analysis is already a tool that brings tons of benefits to big firms. However, many SMEs are thinking of data analysis as something “Too Much” and “Unnecessary” for their business.
Is it the truth? Absolutely NO.
You might be doubting what I said, but first, let me ask you a few questions.
- Can you quickly identify customers and market trends?
- Do you need to spend hours generating a report, instead of minutes?
- Can you view your KPIs at one glance?
- Is it effortless for you to generate reports with Excel?
If you answer “NO” to any of the above questions, you might need to think of using data analytics or switch to better data analytics, just like Super Chain.
What is data analysis
In short, data analysis is a process of inspecting, cleansing, transforming, and modeling data with the goal of discovering useful information that can be used for decision-making purposes.
There are three common types of data analysis:
Descriptive analytics: This type of data analysis answers the question “What happened?” by providing descriptive statistics, such as averages, sums, and counts.
Diagnostic analytics: This type of data analysis helps you understand the causes of past events by identifying patterns and relationships in data.
Predictive analytics: This type of data analysis uses historical data to make predictions about future events.

Signs you need data analysis
You cannot prepare well for the future trends
The first sign that you need data analysis is when you cannot prepare well for future trends. No one knows what will happen in the future, but with data analytics, you can at least have an idea of what might happen and be prepared for it.
For example, if you are selling winter clothes and there is a sudden spike in the demand for summer clothes, you can be prepared for it and order the necessary stock in advance.
If you cannot prepare well for future trends, it is very likely that you do not have enough actionable insights. And if you do not have enough actionable insights, you will not be able to make well-informed decisions.
What is the solution? Data analysis.
You/ your employee is using lots of time on reporting
The second sign that you need data analysis is when you or your employees are spending too much time on reporting.
It is common for workers to spend 2 to 4 hours generating a report. However, what are their working hours? How many reports do they need to generate a week? If you carefully think about it, you will realize that they are actually spending a lot of their time on reporting.
However, you can quickly generate reports in minutes or even seconds, instead of hours, with data analytics. In addition, data analysis can help you automate your reporting process so that your employees can focus on more important tasks.

Switching between places to view KPIs makes you feel time-consuming
The third sign that you need data analysis is when you feel time-consuming and frustrated when switching between places to view KPIs.
For example, if you want to view the sales of your products, you will need to switch between the sales report, customer database, and product database. This process can be very time-consuming and frustrating.
With data analysis, you can view all the KPIs at one glance. In addition, data analysis can help you customize your dashboard so that you can view the KPIs that are most important to you.
Excel is not providing the complex data analysis you need
The fourth sign that you need data analysis is when Excel is not providing the complex data analysis you need.
Excel is a great tool for simple data analysis. However, if you need to perform complex data analysis, such as predictive analytics, Excel is not the right tool for the job.
For example, if you want to track the customer journey or calculate customer lifetime value, Excel will not be able to help you. Also, if you have a large amount of data, Excel will be very slow and difficult to use.
On the other hand, data analysis can help you with complex data analysis. Take Super Chain as an example, it is able to conduct detailed analyses, such as ad campaigns analysis and profit analysis, that evaluate the effectiveness of different advertisements, identify the best-selling products, etc.
You should never underestimate the power and usability of data analytics as it can help you in many ways, from making better decisions to saving time and money. If you think you need data analytics, don’t hesitate to get started. It will definitely be worth your while.

The benefits of data analysis
Data analysis is not only for big firms but also for SMEs. In fact, data analysis can provide even more benefits to SMEs because they often have fewer data to work with. This means that they can get more insights from their data in a shorter amount of time.
Data analysis can help you achieve many different objectives, such as:
Identifying new opportunities for growth
With data analysis, businesses can track customer behavior and preferences. This allows businesses to identify new opportunities for growth, such as developing new products or services that cater to their customers’ needs.
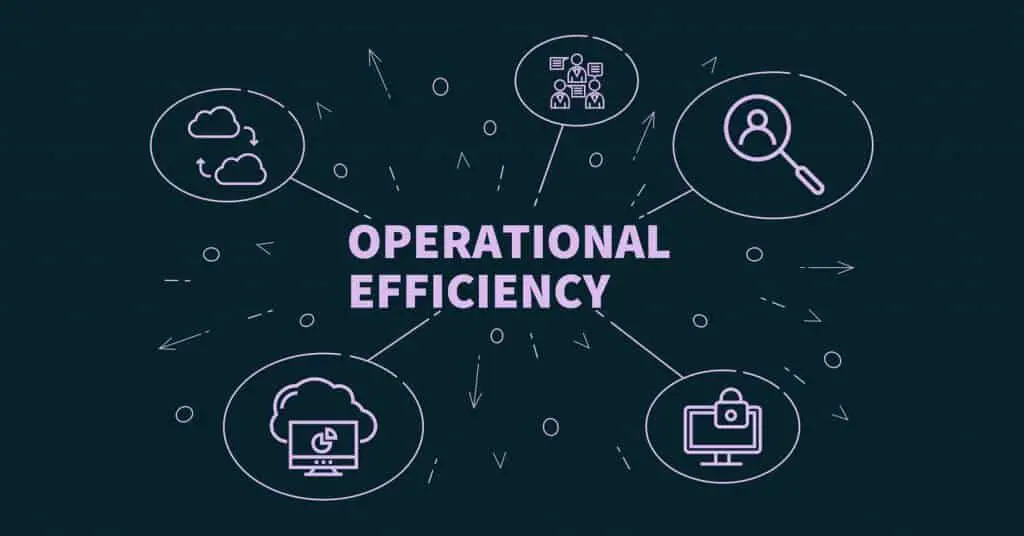
Improving operational efficiency
Data analysis can also help businesses improve their operational efficiency by identifying inefficiencies and bottlenecks in their processes. By streamlining their processes, businesses can save time and money.
Detecting and preventing fraud
Data analysis can also be used to detect and prevent fraud. By analyzing data patterns, businesses can identify unusual behavior that could be indicative of fraud.
Making better decisions faster
By analyzing data, businesses can identify trends and patterns quickly, allowing them to make informed decisions in a timely manner. For instance, if a business notices that its sales are declining, it can quickly take action to rectify the situation.
Increasing customer satisfaction and loyalty
Customer satisfaction and loyalty may also be increased through the use of data analysis. By understanding their customers’ needs and preferences in analysis, businesses can provide them with the products and services they want. This, in turn, increases customer satisfaction and loyalty.
Reducing costs
For instance, by analyzing customer data, businesses can identify areas where they are spending more money than necessary. They can then take steps to reduce these costs, such as renegotiating contracts with suppliers or cutting down on advertising expenses.
Conclusion
Data analysis is a powerful tool that can help you achieve many different objectives. It can help you identify new opportunities for growth, improve operational efficiency, detect and prevent fraud, make better decisions faster, and increase customer satisfaction and loyalty. In addition, data analysis can help you reduce costs. If you think you could benefit from data analytics, don’t hesitate to get started. It will definitely be worth your while.
Not sure where to start? Super Chain is here to help you! We are a team of passionate data analysts who are committed to helping SMEs grow their business through data-driven decision-making. Contact us today to find out how we can help you.